Projects

Sales Trends Explorer

An interactive marimo notebook that explores trend and seasonality in sales.

  • marimo
  • time series
  • pandas
Question
How do trend, seasonality and noise combine to shape a monthly sales series?
Approach
Generate a synthetic series and adjust trend, seasonal amplitude and noise with sliders.
Result
With the default settings, average sales peak in April and bottom out in October.
Data notes
Synthetic data generated in the notebook; no real data. Runs in the browser via /wasm.
Customer Segments App

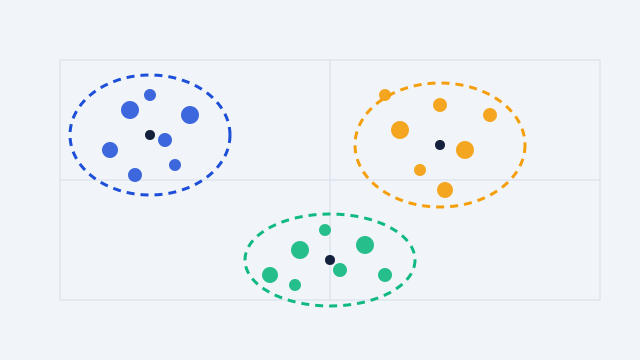
A Streamlit app that clusters customers and lets you inspect each segment.

  • Streamlit
  • clustering
  • scikit-learn
Question
Can customers be grouped into distinct segments by spend, visits and basket size?
Approach
K-means clustering on standardised features, with the number of segments and customers adjustable in the app.
Result
With k = 3 the app recovers three distinct, similar-sized groups: high spenders, frequent visitors and low-spend shoppers.
Data notes
Synthetic data generated in the app, with no personal information. Well-separated groups make this easier than real data.

Forecasting Walkthrough

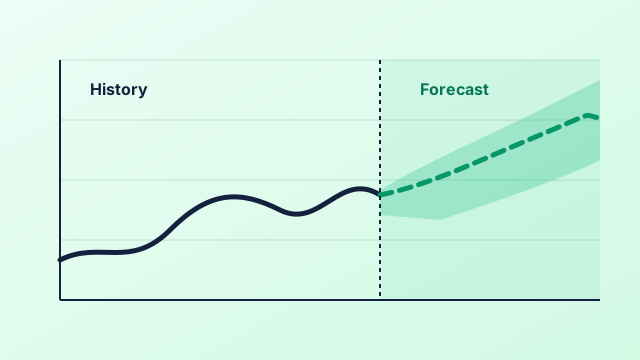
A marimo notebook that compares simple baseline forecasts with a trend-plus-seasonality model.

  • marimo
  • forecasting
  • WebAssembly
Question
How much does a trend-plus-seasonality model improve on simple baselines?
Approach
Backtest naive, seasonal-naive and trend-plus-seasonality models on a held-out period, scored by mean absolute error (MAE).
Result
With the default settings, the trend-plus-seasonality model has an MAE of 5.4, against 14.5 for seasonal naive and 21.1 for naive.
Data notes
Synthetic data generated in the notebook, so results will differ on real series. Runs in the browser via /wasm.

The Central Limit Theorem

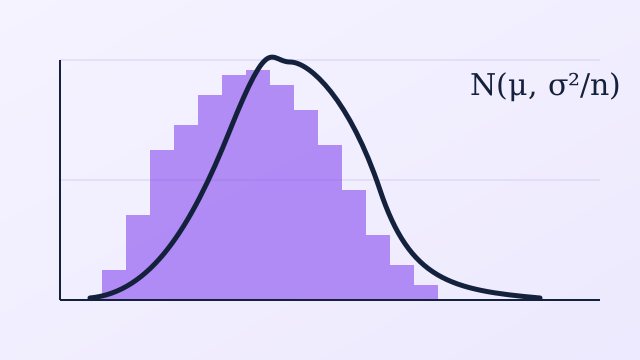
A reproducible Quarto article that uses simulation to illustrate the central limit theorem.

  • Quarto
  • statistics
  • uv
Question
How quickly do means of a skewed distribution become approximately normal?
Approach
Simulate 5,000 sample means at several sample sizes and compare them to the normal curve.
Result
Skewness falls from about 2.0 at n = 1 to about 0.1 at n = 200.
Data notes
Synthetic exponential data with a fixed seed. Reproduce with uv sync && uv run quarto render.

Confidence Intervals Paper

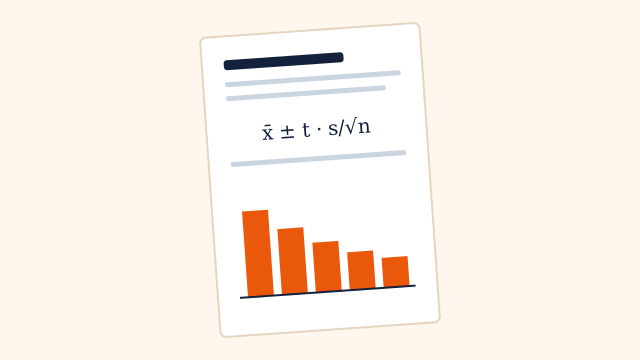
A short Typst paper on confidence intervals for a mean, published as a PDF.

  • Typst
  • statistics
  • uv
Question
How is a confidence interval for a mean built, and how does its width change with sample size?
Approach
A worked t-interval example, typeset in Typst and compiled with uv.
Result
The interval width shrinks in proportion to 1/√n, so quadrupling the sample size halves it.
Data notes
Illustrative numbers only. Reproduce with uv sync && uv run typst compile papers/confidence-intervals.typ.