Code
import matplotlib.pyplot as plt
import numpy as np
from scipy import stats

rng = np.random.default_rng(2026)
sizes = [1, 5, 30, 200]
reps = 5000
means = {n: rng.exponential(1.0, size=(reps, n)).mean(axis=1) for n in sizes}A simulation on synthetic data
How quickly do means of samples drawn from a strongly skewed distribution become approximately normal?
Let \(X_1, \dots, X_n\) be independent draws with mean \(\mu\) and finite variance \(\sigma^2\). The central limit theorem (Billingsley 1995) states that the standardised sample mean converges in distribution to a standard normal:
\[ \frac{\bar{X}_n - \mu}{\sigma / \sqrt{n}} \xrightarrow{d} \mathcal{N}(0, 1) \tag{1}\]
We draw from an exponential distribution with rate 1 (mean 1, strongly right-skewed) and compute 5,000 sample means for each sample size \(n\). All data are synthetic, generated with a fixed seed (Harris et al. 2020).
import matplotlib.pyplot as plt
import numpy as np
from scipy import stats
rng = np.random.default_rng(2026)
sizes = [1, 5, 30, 200]
reps = 5000
means = {n: rng.exponential(1.0, size=(reps, n)).mean(axis=1) for n in sizes}Figure 1 shows the distribution of sample means against the normal curve predicted by Equation 1.
fig, axes = plt.subplots(1, len(sizes), figsize=(11, 2.8), sharey=False)
for ax, n in zip(axes, sizes):
    ax.hist(means[n], bins=40, density=True, color="#1d4ed8", alpha=0.7)
    x = np.linspace(means[n].min(), means[n].max(), 200)
    ax.plot(x, stats.norm.pdf(x, loc=1, scale=1 / np.sqrt(n)), color="#14213d")
    ax.set_title(f"n = {n}")
    ax.set_yticks([])
fig.tight_layout()
plt.show()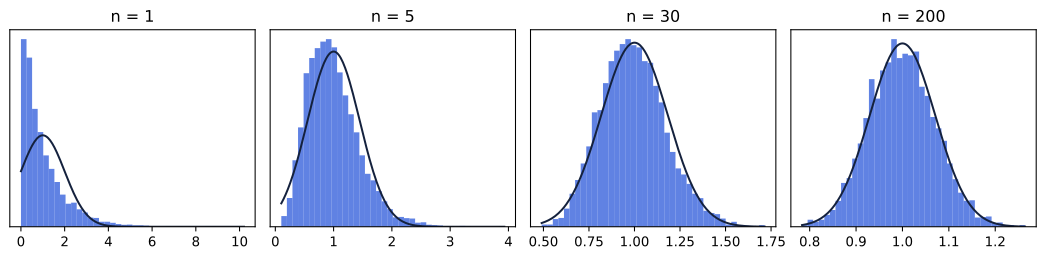
Table 1 quantifies the convergence: skewness shrinks towards 0, the value for a normal distribution.
import pandas as pd
from IPython.display import Markdown

skew = pd.DataFrame(
    {"n": sizes, "skewness": [round(float(stats.skew(means[n])), 3) for n in sizes]}
)
Markdown(skew.to_markdown(index=False))| n | skewness |
|---|---|
| 1 | 1.986 |
| 5 | 0.907 |
| 30 | 0.304 |
| 200 | 0.115 |
Skewness falls from about 2 at \(n = 1\) to close to 0 by \(n = 200\), so the normal approximation is good for moderate sample sizes even for a strongly skewed source.